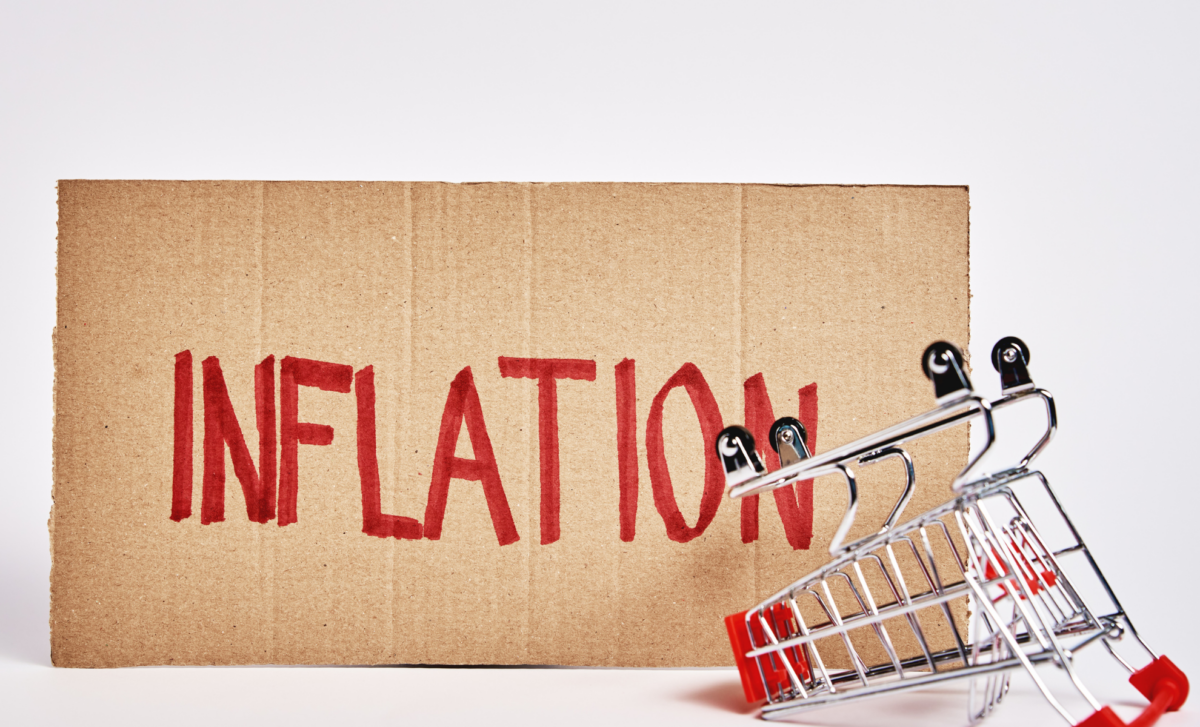
In the intricate mosaic of the United Kingdom’s economic landscape, the omnipresent force of inflation plays a pivotal role, subtly but significantly influencing the costs associated with everyday essentials.
Inflation’s Influence on the Cost of Goods and Services in the UK
In an unforeseen development, the United Kingdom’s annual inflation rate defied expectations by remaining unchanged at 4% in January.
This surprising steadiness comes on the heels of rising energy prices, offsetting the first monthly decline in food and drink costs witnessed in over two years.
Economists, anticipating a modest increase in inflation for the second consecutive month, were taken aback by the resilient 4% figure.
The Office for National Statistics, compiling this data through the consumer prices index and tracking individual goods and services, provides a comprehensive overview of the shifts in the cost of everyday items over the past year.
Delving into the intricacies of consumer economics, this list unveils the percentage changes in prices for various items over the past year in the United Kingdom.
Foods
- Whole milk -10%
- Butter -7.8%
- Low-fat milk -6.1%
- Jams, marmalades, and honey -1.1%
- Fish 1.5%
- Bread 2.1%
- Cheese and curd 2.5%
- Ready-made meals 5.2%
- Fruit 7.1%
- Eggs 7.2%
- Vegetables 8.9%
- Pasta products and couscous 10.8%
- Pork 13.1%
- Sauces and condiments 11.5%
- Sugar 18%
- Olive oil 38.2%
Drinks & Tobacco
- Cocoa and Powdered Chocolate: 25.1%
- Tobacco: 16.1%
- Fruit and Vegetable Juices: 12.2%
- Beer: 9.2%
- Wine: 8%
- Spirits: 7.7%
- Tea: 10.6%
- Mineral or Spring Waters: 10.7%
- Soft Drinks: 3.6%
- Coffee: 0.8%
Energy Sources
- Gas and Electric Meter
- Gas: -26.5%
- Electricity: -13%
- Liquid Fuels: -17.4%
- Solid Fuels: -4.1%
Apparel and Footwear
- Infants and Children’s Garments: 7.4%
- Women’s Garments: 6.6%
- Men’s Garments: 4.6%
- Footwear: 2.6%
Home Essentials and Furniture:
- Cookers: 5.6%
- Fridge: Unchanged
- Carpets and Rugs: 0.2%
- Garden Furniture: 0.2%
- Lighting Equipment: -0.5%
- Household Furniture: -1.5%
Transportation: Vehicles and Passenger Transport
- By Bus and Coach: 10.2%
- By Sea and Inland Waterway: 7.2%
- By Air: 5.8%
- By Train: 4.4%
- New Cars: 3.3%
- Car: Unchanged
- Bicycles: -1.6%
- Motorcycles: -3.8%
- Second-hand Cars: -5.9%
- Petrol: -6.4%
- Diesel: -13.8%
Leisure and Hospitality
- Holiday Centres, Campsites, and Youth Hostels: 19.5%
- Museums: 8.3%
- Restaurants and Cafés: 8.2%
- Fast Food and Takeaway Services: 7%
- Cinemas, Theatres, and Concerts: 6.9%
- Hotels and Motels: 3.5%
- A Suitcase: Unchanged
Recreational Items
- Veterinary and Other Services for Pets: 11.6%
- Garden Products: 4.2%
- Products for Pets: 3.9%
- Board Games: Unchanged
- Games, Toys, and Hobbies: 1.2%


