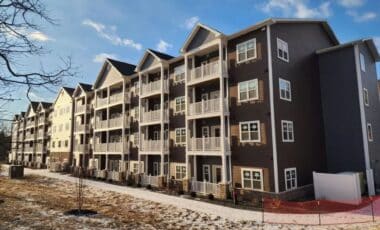
Pending home sales in the United States recorded their steepest year-over-year decline in twelve months during the four weeks ending February 15. The latest data points to a winter housing market marked by cautious buyers, moderating prices, and constrained supply. The figures reflect a broader cooling trend that has defined much of the past year. Although mortgage rates have eased from recent peaks, elevated borrowing costs and still-high home prices continue to weigh on affordability, reshaping both buyer and seller behavior.
Demand Retreats as Contracts Fall and Homes Linger on the Market
U.S. pending home sales fell 5.8 percent compared with a year earlier in the four weeks ending February 15, marking the biggest annual decline in a year, according to Redfin. Pending sales, which track signed contracts before closing, offer an early indication of completed transactions in the months ahead.
At the same time, homes that did go under contract took longer to secure buyers. The typical property spent 67 days on the market, one week longer than a year earlier and the longest span since early 2019, according to Redfin. The slowdown has unfolded despite mortgage rates trending lower. Freddie Mac data cited by Redfin show the weekly average 30-year fixed rate at 6.09 percent, near a three-year low but still roughly double pandemic-era levels.
Prices have not reversed course. The median home-sale price rose 1.1 percent year over year to $379,176 during the same four-week period, Redfin reported, while the median asking price increased 3.3 percent to $412,735. The median monthly mortgage payment stood at $2,601 at a 6.09 percent rate, down 2.9 percent from a year earlier but still close to record highs.
National Association of Realtors data underscore the softness. Contracts to purchase previously owned homes slipped 0.8 percent in January from the prior month, bringing the pending home sales index to 70.9, according to NAR figures reported by Reuters. Economists had expected an increase. Year over year, contracts declined 0.4 percent, with decreases concentrated in the Northeast and South, while the Midwest and West posted gains.
Supply Tightens as Sellers Pull Listings and Leverage Shifts
The cooling in demand is now influencing supply. New listings dropped 3.1 percent year over year in the four weeks ending February 15, while the total number of homes for sale fell 1.5 percent, marking a second consecutive annual decline after nearly two years of increases, according to Redfin.
Active listings totaled 997,176, down 3.2 percent from a year earlier. Months of supply stood at 5.6, up 0.4 points, a level that Redfin describes as broadly balanced. Even so, other indicators suggest buyers are gaining negotiating room. The share of homes sold above list price fell to 19.3 percent from 21 percent a year earlier, and the average sale-to-list price ratio edged down to 97.8 percent.
Buyer activity measures remain mixed. Mortgage-purchase applications were up 8 percent from a year ago, according to the Mortgage Bankers Association data cited by Redfin, though they declined 3 percent week over week. Google searches for “homes for sale” were essentially unchanged from a year earlier, while Redfin’s Homebuyer Demand Index was down 10 percent.
“There are a few things keeping buyers at home, like snowy weather and 6%-plus mortgage rates,” Aaron Glicken, a Redfin Premier agent in Nashville, said in comments published by Redfin. He added that for those actively searching, “it’s the strongest buyer’s market I can remember,” noting that some sellers remain firm on price while others are more flexible. Together, the data portray a housing market adjusting to sustained affordability pressures, with both buyers and sellers recalibrating expectations as the spring season approaches.